5 Top Takeaways from Tech Workforce Surveys

You can learn a lot about the IT community by just asking a few questions. Like how much money they earn, what they like about their jobs, and whether their employers are hiring.
The answers to these types of questions (and more) can be found in some recent annual surveys from leading tech websites and membership organizations.
Below are some of the highlights from five credible, large-scale surveys that aim to take the pulse of the IT workforce.
>> Find HIT Consulting Jobs Here
The data in each are useful to uncover industry trends and to learn more about the makeup and earning power of your peers. Salary surveys, in particular, can help you benchmark your own pay, and may provide valuable ammunition to make the case for a raise.
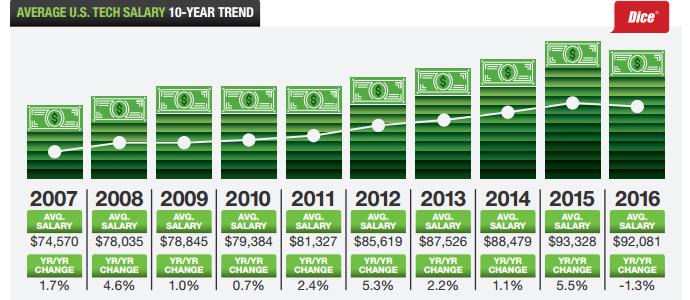
Dice Tech Salary Survey
Respondents: 12,907 employed technology professionals drawn from Dice registered members and website visitors.
Why Read It: The long-running Dice survey is a great source of year-over-year trend data. Salary breakouts by technical skill show which technologies are in highest demand.
Key Takeaway: Networking and storage are hot. “The migration from hardware-based storage to cloud storage and the explosion of IoT technologies connecting billions of devices (Gartner) are creating a demand for skills to support these transitions and growth.”
Fun Fact: The average annual salary of tech workers in Minneapolis, MN is $99,404. That’s the fourth highest pay rate in the country, outpacing cities like New York, Seattle and Atlanta.
Stack Overflow Developer Survey
Respondents: 64,227 software developers from 213 countries and territories around the world, primarily visitors to the Stack Overflow website and its subsidiary channels.
Why Read It: The large sample size and global nature of the survey make it worth the time as well as its focus on the developer community versus other IT professions.
Key Takeaway: Java Script remains the most common programming language of the development community, used by 63% of respondents. SQL ranks second at 51%.
Fun Fact: A majority of developers say they are underpaid, including 11.6% who categorize themselves as “greatly underpaid.”
HIMSS Leadership and Workforce Survey
Respondents: 368 health IT leaders in North America drawn from the membership ranks of the Health Information Management Systems Society (HIMSS).
Why Read It: Provides an annual view into health IT hiring trends from the largest membership organization serving the industry.
Key Takeaway: Health IT continues to be a bright spot in the U.S. economy, according to the report. The majority of health IT employers grew or at least maintained the size of their IT workforce over the past year.
Fun Fact: Hospitals are hiring. Only 28% of respondents at hospitals said they were ‘fully staffed,’ while 61% said they had open positions to fill.
Computerworld IT Salary Survey
Respondents: 2,782 subscribers to Computerworld who are self-described as fully or partially employed in an IT job function.
Why Read It: The survey draws from a broad cross-section of IT workers nationally and the results include a helpful calculation of total compensation, by role, inclusive of base salary and bonuses.
Key Takeaway: IT salaries are still on the rise, although increases were down slightly this year. The near-term job outlook, according to Computerworld, has been muddled by the Trump administration. Analysts have mixed views on whether Trump policies on issues like taxes and immigration will dampen or accelerate IT hiring.
Fun Fact: Certification matters. 58% of respondents said they held at least one technical certification, and 47% had plans to pursue a certification.
PMI Global Project Management Survey
Respondents: 3,234 project management professionals globally representing different levels within organizations from diverse industries.
Why Read It: Poorly managed projects are a source of huge waste in large organizations. The annual PMI (Project Management Institute) survey highlights best practices for project management in high-performing organizations that lead to more successful business outcomes.
Key Takeaway: PMOs are growing as a primary vehicle for executing an organization’s portfolio of projects and strategic initiatives. Agile methodologies are also gaining traction with 71% of organizations reporting that they “use agile approaches to their projects sometimes or more frequently than in the past.”
Fun Fact: While overall project success rates are on the rise, PMI still estimates that organizations waste an average of $97 million for every $1 billion invested, due to poor project performance.
